Calculating standard deviation in Excel is simple. Just use the STDEV function and input the data range.
Now, let’s dive into the details of how to calculate standard deviation in Excel. Standard deviation is a measure of how much the data values deviate from the mean. It is an essential statistical tool used in various fields, including finance, physics, and engineering.
Excel has a built-in function called STDEV, which calculates the standard deviation of a range of data. The function takes the data range as input and returns the standard deviation as the output. By using the STDEV function, you can easily calculate the standard deviation of a data set in Excel. We will discuss how to use the STDEV function and some other tips and tricks to calculate standard deviation in Excel.

Credit: www.wikihow.com
Introduction To Standard Deviation
The Concept Of Variability
Standard deviation is a statistical measure that calculates the amount of variation or dispersion in a set of values. It helps in understanding how much the values differ from the mean. In simpler terms, it gives an indication of how spread out the data points are from the average. Calculating standard deviation in Excel enables analysts and researchers to gauge the consistency or variability within a dataset, providing valuable insights into the distribution of the data.
Importance In Data Analysis
Standard deviation is crucial in data analysis as it provides a clear understanding of the spread of data points. By quantifying the amount of dispersion, it allows analysts to assess the reliability of the data and make informed decisions. In fields such as finance, science, and engineering, standard deviation is used to measure risk, determine confidence intervals, and evaluate the precision of experimental results. Understanding how to calculate standard deviation in Excel is essential for professionals dealing with large datasets and seeking to draw meaningful conclusions from the data.
Credit: www.youtube.com
Excel Basics For Statistical Functions
When it comes to analyzing data and performing statistical calculations, Microsoft Excel is a powerful tool that is widely used by professionals in various fields. Whether you are a student, a researcher, or a business analyst, having a good understanding of Excel’s statistical functions can greatly enhance your data analysis capabilities.
Navigating The Excel Interface
Before we delve into the world of statistical functions in Excel, let’s first familiarize ourselves with the Excel interface. When you open Excel, you are greeted with a blank workbook consisting of cells organized into rows and columns. The ribbon at the top of the screen contains various tabs, each housing different commands and functions.
To navigate through the Excel interface efficiently, you can use the following tips:
- Use the arrow keys to move between cells.
- Press Ctrl + Home to quickly jump to cell A1.
- Press Ctrl + End to go to the last cell with data.
- Use the scroll bars on the right and bottom to navigate through larger worksheets.
Identifying Key Statistical Functions
Excel offers a wide range of statistical functions that can help you analyze and interpret your data. Here are some of the key statistical functions you should be familiar with:
| Function | Description |
|---|---|
| AVERAGE | Calculates the average of a range of cells. |
| STDEV | Calculates the standard deviation of a range of cells. |
| CORREL | Calculates the correlation coefficient between two sets of data. |
| TTEST | Performs a t-test to determine if two samples are significantly different from each other. |
These are just a few examples, and Excel offers many more statistical functions to suit different analysis needs. By understanding the purpose and usage of these functions, you can leverage Excel to perform complex statistical calculations with ease.
Now that we have covered the basics of navigating the Excel interface and identifying key statistical functions, you are ready to dive into the world of data analysis using Excel. In the upcoming sections, we will explore in detail how to calculate standard deviation in Excel and unleash the full potential of this powerful tool.
Preparing Your Data Set In Excel
Learn how to calculate standard deviation in Excel by first preparing your data set accurately. Utilize Excel’s functions to easily compute standard deviation for effective data analysis. Mastering this process can enhance your data interpretation and decision-making capabilities.
Data Entry Best Practices
When entering data in Excel, ensure accuracy and consistency.
Use descriptive labels for each column.
Organizing Data For Analysis
Arrange data in sequential order for clarity.
Group related data together for easy reference.
Standard Deviation Formulas In Excel
Calculating the standard deviation is a crucial statistical analysis that helps measure the variability or dispersion of a dataset. In Excel, you can easily calculate the standard deviation using built-in functions. This blog post will guide you through the different standard deviation formulas in Excel, including the differences between STDEV.P and STDEV.S and the syntax and arguments used in the formulas.
Stdev.p Vs. Stdev.s
When it comes to calculating the standard deviation in Excel, there are two main functions you can use: STDEV.P and STDEV.S. These functions are used to calculate the standard deviation for a population and a sample, respectively.
The STDEV.P function is used when you have the entire population data. It calculates the standard deviation by considering all the values in the dataset. On the other hand, the STDEV.S function is used when you only have a sample of the population. It estimates the standard deviation based on a subset of the data.
Here’s the syntax for both functions:
| Function | Syntax |
|---|---|
| STDEV.P | =STDEV.P(number1, [number2], …) |
| STDEV.S | =STDEV.S(number1, [number2], …) |
In the syntax, number1, number2, and so on represent the values or range of cells containing the dataset for which you want to calculate the standard deviation. You can include multiple numbers or cell references separated by commas.
Formula Syntax And Arguments
When using the standard deviation formulas in Excel, it’s important to understand the syntax and arguments used.
The STDEV.P and STDEV.S functions take the same arguments, which are the numbers or cell references that represent the dataset. You can input these arguments directly into the function or use a range of cells that contain the data.
Here’s an example of the formula syntax:
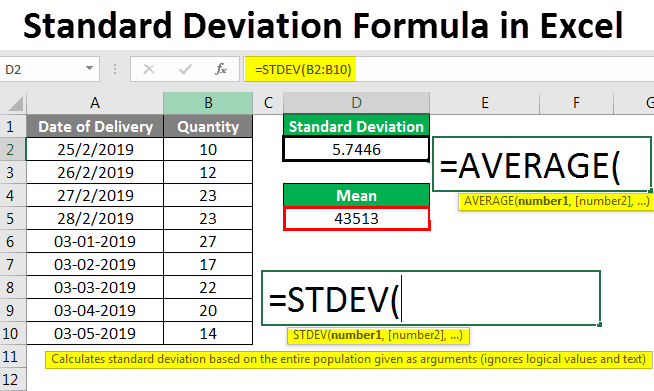
=STDEV.P(A1:A10)This formula calculates the standard deviation for the range of cells A1 to A10. You can adjust the range to fit your dataset.
Additionally, both functions ignore any text or logical values in the dataset, considering only the numerical values for the calculation. If a cell contains an error value, it will be included in the calculation and may affect the result.
It’s important to note that the STDEV.P and STDEV.S functions return the standard deviation as a numeric value. If you want to display the result with a specific number of decimal places, you can format the cell accordingly using Excel’s formatting options.
By understanding the differences between STDEV.P and STDEV.S and mastering the formula syntax and arguments, you can easily calculate the standard deviation in Excel for both populations and samples. This statistical analysis provides valuable insights into the variability of your data, helping you make informed decisions.
Step-by-step Calculation Of Standard Deviation
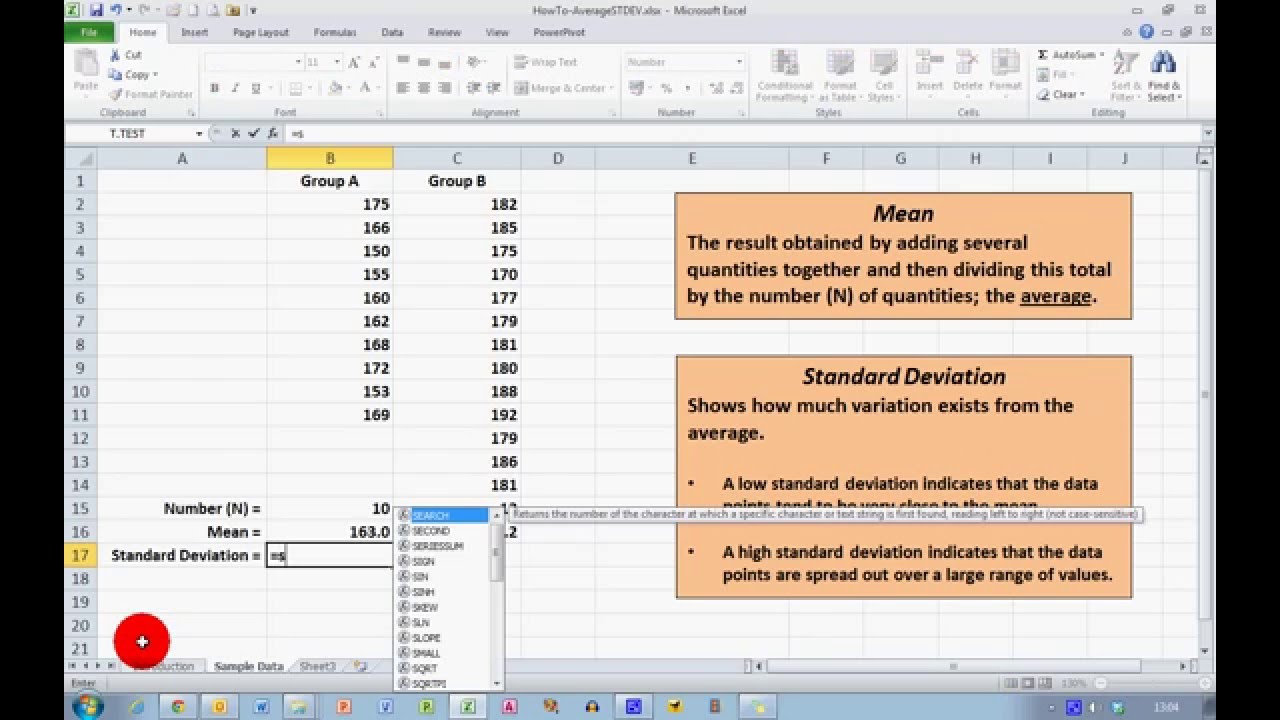
To calculate standard deviation in Excel, you can use the STDEV. P function, which takes a range of values as its argument. Simply input the range of data into the function to find the standard deviation. This method provides a step-by-step approach to calculating standard deviation directly in Excel.
Calculating the standard deviation in Excel is a crucial statistical function that measures the amount of variation in a dataset. It is essential to understand how to calculate standard deviation in Excel to analyze data effectively. Follow these simple steps to calculate standard deviation in Excel:Selecting The Right Cells
The first step is to select the range of cells that contain the data you want to analyze. It is crucial to select the correct cells to ensure accurate results. Simply click and drag the cursor over the cells that contain the data you want to analyze.Executing The Function
Once you have selected the cells, you can execute the standard deviation function in Excel. To do this, you need to use the formula =STDEV.S() or =STDEV.P(). The STDEV.S() function is used when you are working with a sample of data, while the STDEV.P() function is used when you have the entire population data. To execute the function, follow these steps:- Select the cell where you want to display the standard deviation result.
- Type the formula =STDEV.S() or =STDEV.P() depending on the type of data you have.
- Enter the range of cells that you selected in step 1 as the argument for the formula.
- Press Enter to calculate the standard deviation.
Interpreting The Results
Understanding The Output
After calculating the standard deviation in Excel, it’s crucial to understand the output. The standard deviation is a measure of the amount of variation or dispersion of a set of values. In simpler terms, it shows how much the values differ from the mean (average). A low standard deviation indicates that the values tend to be close to the mean, while a high standard deviation indicates that the values are spread out over a wider range.
Comparing Standard Deviation Values
When interpreting the results of standard deviation calculations in Excel, it’s essential to compare the values. If you have multiple sets of data, compare the standard deviation values to determine which dataset has more consistent or stable values. A smaller standard deviation indicates less variability within the data, whereas a larger standard deviation implies greater variability.
Common Mistakes To Avoid
When calculating standard deviation in Excel, it’s important to avoid common mistakes. Check your data is correct, use the correct formula, and ensure you are selecting the right cells. Double-check your work to avoid errors.
Incorrect Range Selection
Choosing the wrong data range can lead to inaccurate standard deviation calculations.
Misunderstanding The Difference Between Stdev.p And Stdev.s
STDEV.P is for an entire population, while STDEV.S is for a sample dataset.
Ensure the correct function is used based on your data set size.
Credit: www.educba.com
Advanced Tips For Using Standard Deviation In Excel
Discover advanced tips for utilizing standard deviation in Excel to calculate the variability of data. Learn how to easily calculate standard deviation in Excel using simple steps and improve your data analysis skills. Enhance your understanding of statistical measurements with this comprehensive guide.
Creating Dynamic Ranges
Utilize OFFSET and COUNTA functions to create dynamic ranges in Excel.
Visualizing Data With Standard Deviation
Represent data visually using charts to illustrate standard deviation in Excel.
Conclusion And Further Resources
Learn how to calculate standard deviation in Excel effortlessly. Discover additional resources for mastering this statistical measure.
Recap Of Key Steps
After following the steps to calculate standard deviation in Excel, you now have a solid understanding of this statistical measure.
Continuing Your Excel Education
Explore further Excel functions to enhance your data analysis skills.
Frequently Asked Questions
How Do I Calculate Standard Deviation In Excel?
To calculate standard deviation in Excel, use the STDEV function. Enter the range of numbers you want to calculate the standard deviation for, preceded by an equal sign. For example, “=STDEV(A1:A10)”. Press Enter, and Excel will display the standard deviation for the given range of numbers.
Should I Use Stdev S Or Stdev P In Excel?
Use STDEV. S for a sample and STDEV. P for a population in Excel.
How Do You Calculate Stdev S In Excel?
To calculate STDEV in Excel, use the formula =STDEV. S(range of values). Press Enter. Done!
How Do I Calculate Standard Deviation?
To calculate standard deviation, follow these steps: 1. Find the mean of the data set. 2. Subtract the mean from each data point. 3. Square each result. 4. Find the mean of the squared differences. 5. Take the square root of that mean.
Conclusion
To sum it up, calculating standard deviation in Excel is a useful skill for data analysis. By following the step-by-step instructions provided in this blog post, you can easily calculate the standard deviation of a set of data using Excel’s built-in functions.
Understanding the variability of data can help in making informed decisions and drawing meaningful conclusions. So, whether you are a student, researcher, or professional, mastering this Excel function can greatly enhance your analytical capabilities. Happy calculating!