Are you struggling to understand market swings and unsure how to protect your investments? Measuring volatility is the key to making smarter decisions and staying ahead of unpredictable changes.
By learning how to measure volatility, you gain the power to spot risks before they hit and find opportunities others might miss. You’ll discover simple and effective ways to track market movements, so you feel confident and in control of your financial future.
Keep reading to unlock the secrets that can transform the way you approach investing.
What Is Market Volatility
Market volatility shows how much prices change over time. It reflects how fast and how far prices move. High volatility means prices jump a lot. Low volatility means prices stay stable.
Volatility affects investors and traders. It helps them understand risks and chances in the market. Knowing what volatility is helps you prepare for price swings.
Definition Of Market Volatility
Market volatility measures price changes in stocks, bonds, or other assets. It tracks ups and downs in a set period. Volatility shows the speed and size of these changes.
Why Market Volatility Happens
Prices change due to news, events, or economic data. Fear and greed also cause big swings. Many buyers or sellers can move prices quickly.
Impact Of Market Volatility
Volatility can create chances for profit and risks of loss. It affects investment decisions and trading strategies. Understanding volatility helps manage these risks better.
:max_bytes(150000):strip_icc()/Volatility-89fb205b705c493ba02c00a3fc4964cd.jpg)
Credit: www.investopedia.com
Why Volatility Matters In Investing
Volatility plays a key role in investing. It shows how much a stock or market price changes over time. Understanding volatility helps investors manage risks and make better choices.
Investors use volatility to measure uncertainty. High volatility means prices can change quickly and by large amounts. Low volatility means prices are more stable. Both have pros and cons.
What Volatility Tells Investors
Volatility reveals the risk level of an investment. A volatile stock may bring big gains or big losses. Stable stocks often provide steady returns but with less excitement.
Impact On Investment Strategy
Knowing volatility helps set investment goals. Conservative investors may prefer low volatility. Risk-tolerant investors might seek high volatility for higher rewards.
Volatility And Market Trends
Volatility often rises during market uncertainty. It can signal changes in economic or political conditions. Investors watch volatility to adjust their plans.
Common Volatility Metrics
Volatility shows how much the price of an asset changes over time. Traders and investors use different tools to measure this change. These tools help understand risk and market behavior. Below are some common metrics that measure volatility clearly and simply.
Standard Deviation
Standard deviation measures how much prices move from their average. A high value means prices change a lot. A low value shows prices stay close to the average. It is useful for tracking the overall risk of an investment.
Beta Coefficient
Beta compares an asset’s volatility to the whole market. A beta higher than 1 means the asset moves more than the market. A beta less than 1 means it moves less. It helps see how much an asset’s price reacts to market changes.
Average True Range
Average True Range (ATR) measures price movement within a set time. It looks at daily highs, lows, and closes to find true volatility. Traders use ATR to decide entry and exit points. It shows how much an asset typically moves each day.
Volatility Index (vix)
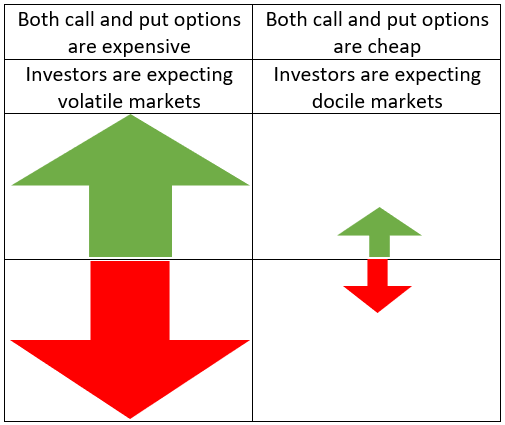
The Volatility Index, or VIX, shows expected market volatility. It is based on options prices of the S&P 500. A high VIX means the market expects big price swings. A low VIX means calm and stable conditions. It is often called the “fear gauge.”

Credit: www.anevis-solutions.com
Tools To Measure Volatility
Measuring volatility is key to understanding market risk and price movement. Different tools help analyze how much prices rise or fall over time. These tools make it easier to see trends and make informed decisions.
Various options exist to measure volatility. Some are software programs, others are online calculators or charting tools. Each tool offers unique features to fit different needs and skill levels.
Financial Software And Platforms
Financial software often includes volatility measurement features. Programs like Bloomberg Terminal and MetaTrader provide detailed data and analytics. They calculate indicators like standard deviation and average true range.
These platforms offer real-time updates and historical data. Traders can customize reports and set alerts for volatility changes. This helps monitor market conditions closely.
Online Volatility Calculators
Online calculators make volatility measurement quick and easy. Users enter price data or stock symbols to get results fast. These tools calculate common metrics like beta and historical volatility.
No installation is needed, and they are free or low-cost. Ideal for beginners or casual investors who want fast insights. Results can guide decisions without complex software.
Charting And Technical Analysis Tools
Charting tools show price movements visually. They help spot volatility by highlighting price swings and volume changes. Indicators like Bollinger Bands and moving averages reveal volatility shifts.
Technical analysis software allows users to draw trend lines and set time frames. This visual approach makes it easier to understand market behavior. Traders use charts to predict future price changes.
Volatility And Risk Management
Volatility affects how much prices go up and down in markets. It creates uncertainty and risk for investors. Managing risk helps protect your money during volatile times.
Smart risk management means planning for price changes. It helps keep losses small and gains steady. There are several ways to manage risk linked to volatility.
Setting Stop-loss Orders
Stop-loss orders limit how much you can lose on a trade. You set a price where your investment will sell automatically. This prevents big losses when prices drop quickly.
Use stop-loss orders to protect your investments. It helps you exit losing trades without waiting. This tool works well in volatile markets.
Portfolio Diversification
Diversification means spreading your money across different assets. It lowers risk by not putting all money in one place. When some investments fall, others may rise or stay steady.
Diversify among stocks, bonds, and other assets. This balance reduces the impact of volatility. A well-diversified portfolio can handle market swings better.
Adjusting Position Sizes
Position size is how much money you put into one trade. Adjust it based on how volatile the market or asset is. Smaller positions reduce risk during high volatility.
Smaller trades mean less chance of big losses. Bigger trades suit stable markets with low volatility. Change position sizes to match market conditions.
Interpreting Volatility For Investment Decisions
Understanding volatility is key for smart investing. It shows how much a stock or market price moves up and down. Interpreting volatility helps decide the best investment approach. It guides you to choose strategies that match your risk comfort and goals.
High Volatility Strategies
High volatility means large price swings. This suits investors who like risk and seek quick gains. Traders may buy low and sell high rapidly. They use tools like options to benefit from price changes. Timing is crucial in these fast markets.
Low Volatility Strategies
Low volatility shows steady price movement. This fits investors who want safer, long-term growth. Stocks with low volatility tend to be more stable. Investors often hold these for years to build wealth slowly. Dividends can add regular income in this approach.
Volatility And Market Timing
Volatility helps with market timing decisions. High volatility can signal potential entry or exit points. Some investors avoid buying during extreme swings. Others see it as a chance to buy undervalued assets. Watching volatility patterns aids in planning trades better.
Common Mistakes When Measuring Volatility
Measuring volatility is key for traders and investors. It shows how much prices move over time. Mistakes in this process can lead to wrong decisions. Avoiding common errors helps to get clearer insights.
Volatility is not just about big price swings. It also involves understanding the pattern and timing of those changes. Many people miss this, which causes confusion.
Using Too Short A Time Frame
Short periods show sudden changes but miss the bigger picture. This can make volatility look higher than it is. Longer time frames give a more balanced view.
Ignoring Different Types Of Volatility
Volatility can be historical or implied. Historical uses past data. Implied reflects future expectations. Mixing them up leads to wrong analysis.
Relying Only On One Volatility Measure
Standard deviation is common but not the only tool. Other measures like average true range add value. Using only one limits understanding.
Not Adjusting For Market Conditions
Volatility changes in calm and active markets. Using the same method all the time misses these shifts. Adjust your approach to market phases.
Overlooking Data Quality
Bad or incomplete data gives faulty volatility calculations. Always check data for errors and gaps before analysis.
Credit: www.swanglobalinvestments.com
Tips For Using Volatility In Smart Investing
Volatility plays a key role in smart investing. Understanding how to use it wisely can help you make better decisions. Volatility shows how much and how fast prices change. This information helps investors know when to buy or sell. Using volatility alone is risky. Combine it with other tools for a clearer picture. Stay aware of current market events. Check volatility often to keep your strategy sharp.
Combine Volatility With Other Indicators
Volatility works best with other signals. Use it alongside trend lines, moving averages, or volume data. These tools help confirm market direction and strength. Volatility alone may give false alerts. Other indicators filter out noise and reduce mistakes. This approach builds a stronger, more reliable plan.
Stay Updated On Market News
Market news affects volatility. Earnings reports, economic data, and political events cause price swings. Follow trusted sources to catch these updates fast. Being informed helps you understand why volatility rises or falls. This knowledge improves timing and reduces risks.
Review Volatility Regularly
Volatility changes over time. Review it often to adapt your strategy. Check daily, weekly, or monthly, depending on your goals. Regular reviews help spot new trends early. Adjust your investments to protect gains and limit losses. Staying active with volatility keeps your plan relevant.
Frequently Asked Questions
What Is Volatility In Financial Markets?
Volatility measures the degree of price variation over time. It indicates market risk and uncertainty. Higher volatility means larger price swings and potential higher returns or losses.
How Do You Calculate Volatility Percentage?
Volatility percentage is often calculated using standard deviation of returns. Multiply the standard deviation by the square root of trading days. This gives annualized volatility, showing expected yearly price fluctuations.
Why Is Measuring Volatility Important?
Measuring volatility helps investors assess risk and make informed decisions. It guides portfolio diversification and timing of trades. Understanding volatility improves risk management and investment strategy.
What Tools Measure Market Volatility Effectively?
Common tools include the VIX index, Bollinger Bands, and Average True Range (ATR). These indicators track price movements and market sentiment to quantify volatility levels.
Conclusion
Measuring volatility helps you understand market risks better. Simple tools like standard deviation and beta give clear insights. Tracking changes daily can guide smarter investment choices. Keep learning and practicing to improve your skills. Volatility shows how prices rise and fall quickly.
Use this knowledge to make more informed decisions. Stay patient and watch the market carefully. This approach builds confidence and reduces surprises. You control your investments by knowing the risks well.