Are you curious about how to track your progress and see real results over time? Knowing how to measure growth rate can unlock powerful insights for your business, investments, or personal goals.
But it’s not always clear where to start or which numbers truly matter. You’ll discover simple, step-by-step methods to calculate growth rate accurately. By the end, you’ll feel confident using this key metric to make smarter decisions and fuel your success.
Keep reading to learn how to turn your data into a clear picture of your growth.
Growth Rate Basics
Understanding growth rate is key to tracking progress over time. It shows how fast something is increasing or decreasing. Growth rate helps in many areas like business, population, and investments.
This section covers the basics of growth rate. It explains what growth rate means and the common types you will see.
What Growth Rate Means
Growth rate measures change in size or amount over time. It shows the speed of growth, usually as a percentage. A positive growth rate means increase, while a negative means decrease.
For example, if a company’s sales grow from $100 to $110, the growth rate is 10%. Growth rate helps compare progress across different times or groups.
Common Growth Rate Types
Several growth rate types exist. The most common are simple growth rate and compound growth rate.
Simple growth rate shows change from one period to the next. It works well for short-term growth.
Compound growth rate measures growth over multiple periods. It accounts for growth on previous growth. This type fits long-term data better.
Other types include annual growth rate and monthly growth rate. These show growth within specific time frames.

Credit: www.wikihow.com
Key Metrics To Track
Tracking growth requires clear, simple metrics. These numbers show how well your business improves over time. They help spot success and areas needing work.
Focus on key areas that reflect your business health. Revenue, customer numbers, and market share give a full view of growth. Understanding these helps guide your next steps.
Revenue And Sales Growth
Revenue shows the total money your business earns. Tracking sales growth means comparing revenue over months or years. A steady rise signals healthy business progress. Watch for dips to catch problems early.
Customer Growth
Customer growth means gaining new buyers or users. Count active customers regularly. More customers usually mean better market reach. Keep track of repeat buyers for loyal customer insights.
Market Share Expansion
Market share shows your business size versus competitors. Increasing market share means you attract more customers than others. Calculate it by dividing your sales by total industry sales. This metric helps measure your competitive strength.
Simple Growth Rate Formulas
Understanding growth rate is key to tracking progress over time. Simple growth rate formulas help measure change clearly. These formulas show how much something has grown between two points.
They are easy to use and apply in many situations. Whether you analyze business, population, or investments, these formulas give quick insights. Let’s explore some common methods to calculate growth rate.
Percentage Growth Calculation
Percentage growth calculation measures how much a value changes in percent. Subtract the old value from the new value. Then, divide the result by the old value. Multiply by 100 to get the percentage growth.
This formula works well for short-term growth checks. It shows growth as a simple, clear number.
Compound Annual Growth Rate (cagr)
CAGR shows the average annual growth rate over multiple years. It assumes growth happens steadily each year. Calculate CAGR by dividing the ending value by the starting value. Then raise this to the power of one divided by the number of years. Subtract one from the result.
CAGR helps compare growth rates across different periods. It smooths out yearly ups and downs.
Average Growth Rate
Average growth rate finds the mean growth rate over a set time. Add all yearly growth rates together. Divide the total by the number of years. This gives the average yearly change.
This method works best when yearly data is available. It gives a simple view of growth trends.
Data Collection Tips
Collecting accurate data is the first step to measure growth rate effectively. Quality data ensures your calculations reflect real progress. Poor data leads to wrong conclusions and decisions. Focus on collecting data that is clear and trustworthy. Keep data organized and consistent for easy analysis.
Choosing Reliable Data Sources
Select data sources known for accuracy and consistency. Official records, verified reports, and trusted databases work best. Avoid sources with frequent errors or missing information. Check the history of the data provider. Reliable sources save time and increase confidence in results.
Setting The Right Time Frame
Choose a time frame that fits your growth measurement goals. Short periods capture quick changes but may include noise. Longer periods show overall trends but miss short-term shifts. Match the time frame to your business cycle or project length. Consistent intervals help track growth clearly over time.
Step-by-step Measurement Process
Measuring growth rate helps track progress over time. It shows how much something has increased or decreased. The process is simple and clear. Follow these steps to measure growth rate accurately.
This step-by-step guide breaks down the measurement process. It helps you gather the right data, apply the formula, and understand the results. Each step is easy to follow, even for beginners.
Gathering Initial And Final Values
Start by finding the initial value. This is the starting point of what you want to measure. It could be sales, population, or revenue at the beginning of a period.
Next, find the final value. This is the value at the end of the same period. Make sure both values are from the same source and measured the same way.
Applying The Formula
Use the growth rate formula to calculate the change. Subtract the initial value from the final value.
Then, divide the difference by the initial value. This gives the growth rate as a decimal.
Multiply the result by 100 to get the percentage growth rate.
Interpreting The Results
A positive growth rate means an increase over time. It shows improvement or expansion.
A negative growth rate means a decrease. It signals decline or loss.
Zero means no change. Values stayed the same during the period.
Use these insights to make informed decisions and plan ahead.
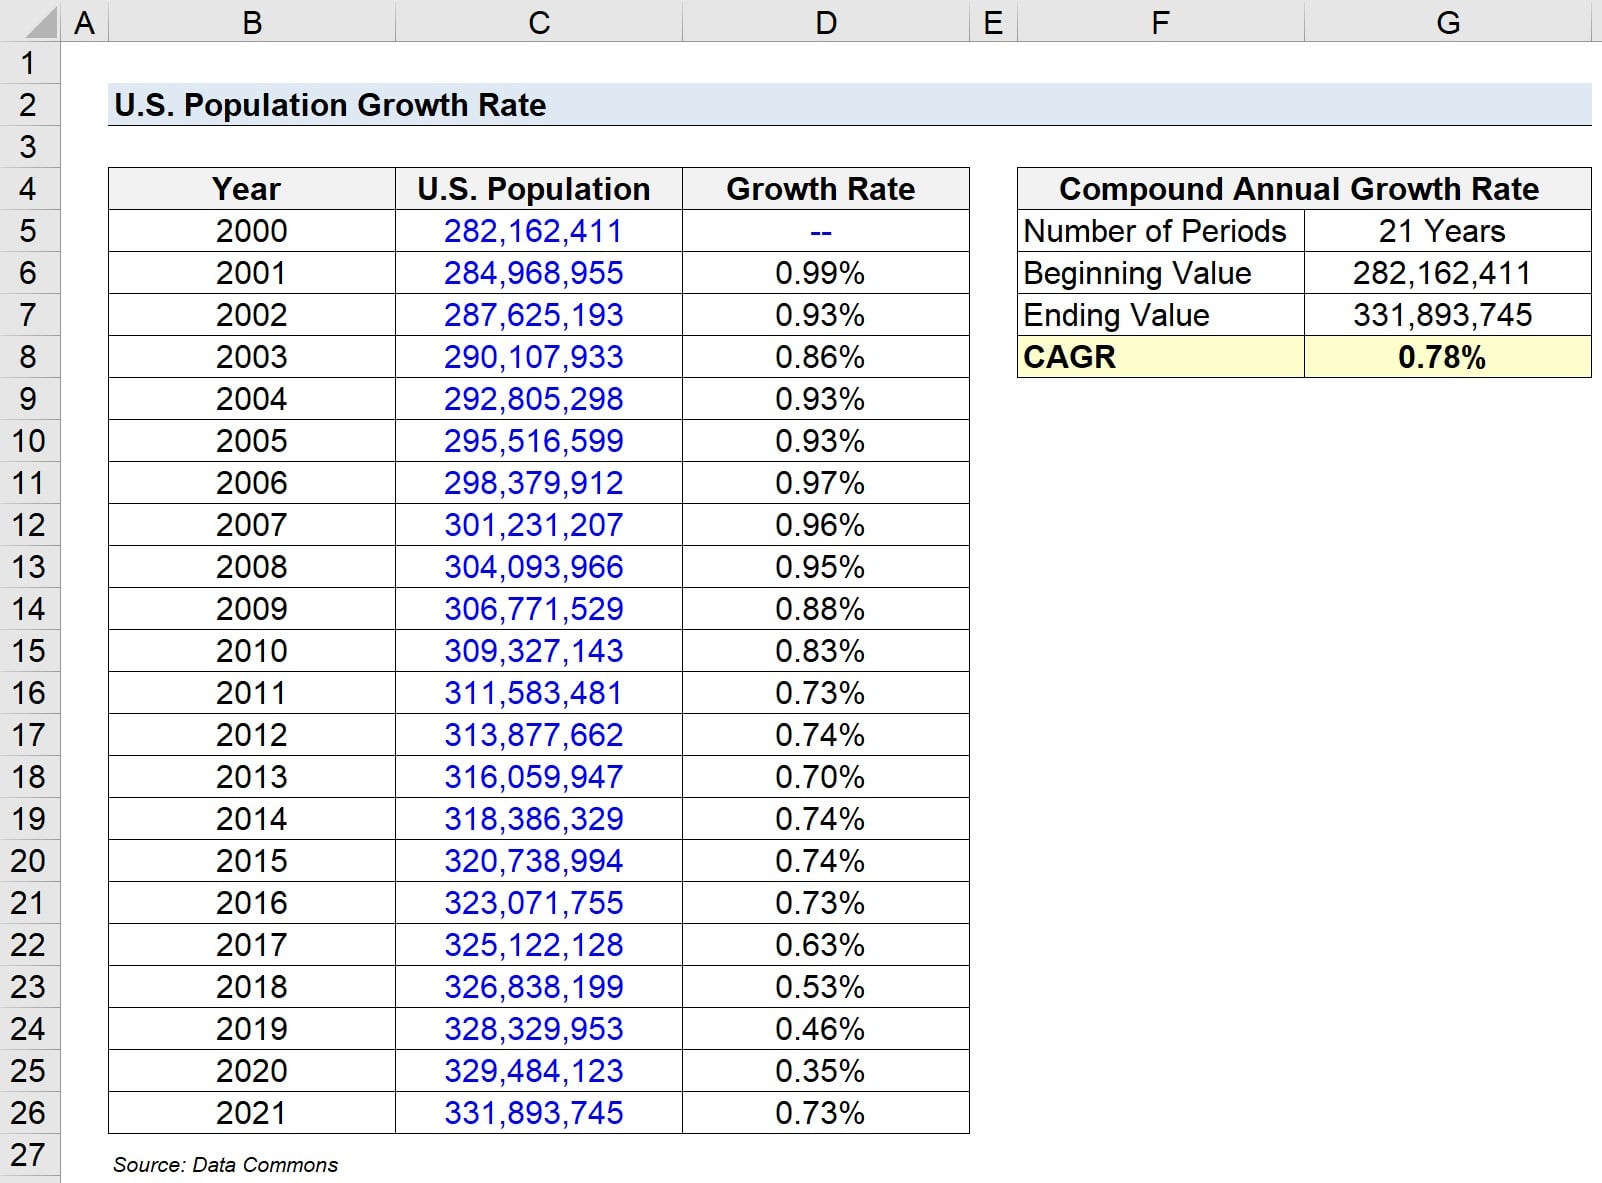
Credit: www.wallstreetprep.com
Common Mistakes To Avoid
Measuring growth rate is important for tracking progress. Many people make mistakes that lead to wrong results. Avoiding common errors helps get clear and useful data. Here are some usual mistakes to watch out for.
Ignoring External Factors
External factors affect growth numbers a lot. Changes in market trends or economy can impact results. Ignoring these can cause wrong conclusions. Always consider outside events that might change growth rates.
Using Inconsistent Data
Data should be consistent over time. Mixing different sources or time periods leads to confusion. Use the same type of data for each measurement. Consistency gives accurate and reliable growth calculations.
Misinterpreting Percentages
Percentages can be tricky to understand. Small changes in numbers may look like big growth. Remember to check the actual values behind percentages. This helps avoid wrong assumptions about growth size.
Tools For Growth Rate Calculation
Measuring growth rate requires the right tools to get accurate results. These tools simplify the process, saving time and effort. Choosing the best tool depends on your needs and the type of data you have.
Several options exist, from simple spreadsheets to advanced analytics software. Each tool offers unique features for calculating growth. Understanding these tools helps you pick the one that fits your situation best.
Spreadsheets And Templates
Spreadsheets like Microsoft Excel or Google Sheets are popular for growth rate calculation. They allow you to enter data and use built-in formulas. Templates can speed up the process with pre-made formulas for growth rates.
Spreadsheets offer flexibility to customize calculations. They work well for small businesses or personal use. You can visualize growth with charts and graphs easily.
Growth Rate Calculators
Online growth rate calculators provide quick results. Enter your starting and ending values along with the time period. The calculator then computes the growth rate instantly.
These tools are simple and require no technical skills. They are helpful for fast checks or when you lack spreadsheet knowledge. Many are free and accessible from any device.
Analytics Software
Analytics software like Google Analytics or business intelligence tools track growth over time. They offer detailed reports and insights. These programs handle large data sets with ease.
Such software is ideal for businesses with complex data needs. They provide more than just growth rate calculations. Features include trend analysis, forecasting, and performance tracking.

Credit: www.wikihow.com
Improving Growth Tracking Accuracy
Tracking growth accurately helps you understand progress clearly. It shows what works and what needs change. Accurate data guides better decisions. Improving how you track growth makes your analysis reliable.
Small errors can cause big misunderstandings. Careful tracking avoids wasted time and resources. Focus on clear, consistent, and updated data to improve accuracy.
Regular Data Updates
Update your data often. Fresh data reflects real changes fast. Old data can mislead your growth rate. Set a schedule to collect and review data regularly. This keeps your tracking relevant and accurate.
Cross-checking Results
Compare data from different sources. This helps find mistakes or gaps. Confirm numbers with more than one method. Cross-checking builds trust in your data. It prevents wrong conclusions about your growth.
Adjusting For Seasonality
Growth can change with seasons or events. Adjust numbers to remove these effects. This shows true growth without temporary spikes or drops. Consider patterns like holidays or market cycles. Seasonal adjustments give a clearer picture of progress.
Frequently Asked Questions
What Is The Formula To Measure Growth Rate?
Growth rate is calculated as [(Ending Value – Starting Value) / Starting Value] × 100%. This formula shows the percentage increase or decrease over a period. It helps track progress in sales, population, or investments efficiently.
Why Is Measuring Growth Rate Important?
Measuring growth rate helps assess business performance and market trends. It reveals if strategies are effective and forecasts future results. This metric guides decision-making and resource allocation for sustainable growth.
How Often Should Growth Rate Be Measured?
Growth rate should be measured regularly, depending on context—monthly, quarterly, or annually. Frequent tracking ensures timely insights and quick responses to changes. Choose intervals that align with your goals and data availability.
What Tools Can Help Calculate Growth Rate?
Tools like Excel, Google Sheets, and financial software simplify growth rate calculations. They automate formulas and generate charts for easy analysis. Using these tools saves time and improves accuracy in tracking growth.
Conclusion
Measuring growth rate helps track progress clearly and simply. It shows how fast something changes over time. Use easy formulas and consistent data for best results. Regular checks keep you updated and guide decisions well. Understanding growth helps plan for future steps wisely.
Keep your methods steady and your data accurate. Growth rate is a key tool for success. Stay patient, observe closely, and adjust your plans as needed.