Are you struggling to understand if your results really matter or if they just happened by chance? Knowing how to measure statistical significance can change the way you interpret data and make decisions.
This simple skill helps you separate real insights from random noise. By the end of this article, you’ll feel confident reading and using statistical significance to support your findings. Let’s dive in and unlock the power behind your numbers!
Credit: help.surveymonkey.com
Basics Of Statistical Significance
Statistical significance helps us understand if a result is real or just by chance. It guides decisions in science, business, and many other fields. Knowing this concept is key to analyzing data correctly.
It tells us if the findings from a study can be trusted or if they might happen randomly. This section explains what statistical significance means and why it matters in data analysis.
What Statistical Significance Means
Statistical significance shows if a result is unlikely to occur by chance. It uses a number called the p-value. A small p-value means the result is probably true, not random.
Researchers often use a cutoff of 0.05. If the p-value is less than 0.05, the result is significant. This means there is less than a 5% chance the result happened by accident.
Importance In Data Analysis
Statistical significance helps avoid wrong conclusions. It tells analysts if their findings have real meaning. Without it, decisions may be based on random data.
This concept improves the quality of research and business reports. It builds trust in the data and supports clear, confident decisions.

Credit: www.youtube.com
Key Concepts And Terms
Understanding key concepts and terms is essential to measure statistical significance. These terms form the foundation of statistical analysis. They help you decide if your results are meaningful or just due to chance.
Each concept plays a role in testing hypotheses and interpreting data. Knowing these terms makes it easier to follow statistical results and make informed decisions.
P-value
The p-value shows the chance of getting your results if the null hypothesis is true. A low p-value means your results are unlikely to happen by chance. Researchers often use a cutoff of 0.05 to decide if the result is significant.
Null Hypothesis
The null hypothesis assumes no effect or no difference between groups. It acts as a starting point for testing. Statistical tests try to prove whether to reject or keep this assumption.
Alternative Hypothesis
The alternative hypothesis states there is an effect or a difference. It is what you want to support with your data. Accepting this means your findings are statistically significant.
Confidence Level
The confidence level shows how sure you are about your results. A 95% confidence level means you trust the results 95 times out of 100. It helps measure the reliability of your conclusions.
Choosing The Right Test
Choosing the right statistical test is key to measuring significance correctly. Each test suits different types of data and questions. Picking the wrong one can lead to false results. Understanding tests helps you analyze data with confidence. It also improves the clarity of your findings.
Types Of Statistical Tests
Several common tests exist for different needs. The t-test compares means between two groups. The chi-square test checks relationships between categories. ANOVA tests differences among three or more groups. Correlation tests measure how two variables move together. Regression examines how one variable predicts another. Non-parametric tests work when data do not fit normal patterns.
When To Use Each Test
Use a t-test for comparing averages from two samples. Pick chi-square to see if categories relate, like gender and preference. ANOVA helps when comparing more than two group averages. Correlation fits when you want to see if variables link. Regression fits when predicting outcomes from one or more variables. Use non-parametric tests when data breaks normal rules or has outliers.
Step-by-step Measurement Process
Measuring statistical significance requires a clear process. It helps you decide if results happen by chance or show a real effect. Follow each step carefully to get reliable results.
This process involves setting up hypotheses, gathering data, calculating statistics, and interpreting outcomes. Each step builds on the last for accurate analysis.
Formulating Hypotheses
Start by stating two hypotheses. The null hypothesis assumes no effect or difference. The alternative hypothesis assumes there is an effect or difference. Clear hypotheses guide your test and results.
Collecting Data
Gather data relevant to your hypotheses. Use reliable methods to avoid errors. The sample size should be large enough to represent the population. Good data is key to valid conclusions.
Calculating Test Statistics
Choose the right statistical test based on your data type and hypotheses. Calculate the test statistic using your data. This number shows how much your data differs from the null hypothesis.
Interpreting P-values
The p-value tells you the chance of seeing your results if the null hypothesis is true. A small p-value means your results are unlikely due to chance. This suggests statistical significance. Common cutoffs are 0.05 or 0.01.
Common Mistakes To Avoid
Measuring statistical significance can be tricky. Many people make common mistakes that lead to wrong conclusions. Avoiding these errors helps you get clear and reliable results. Here are the top mistakes to watch out for.
Misinterpreting P-values
P-values show the chance of getting your results by luck. They do not prove your hypothesis is true or false. A small p-value means your results are unlikely due to chance. It does not mean the effect is important or large. Treat p-values as one part of the analysis, not the whole story.
Ignoring Sample Size
Sample size affects the accuracy of your results. Small samples can give misleading p-values. They may show significance by chance. Large samples provide more reliable evidence but can detect tiny effects that may not matter. Always check if the sample size fits your study goals.
Overlooking Assumptions
Statistical tests require certain assumptions to be true. These include data normality, independence, and equal variances. Ignoring assumptions can invalidate your results. Always check if your data meets these rules before trusting the test outcomes.
Tools And Software For Testing
Testing statistical significance requires the right tools. These tools help analyze data and find meaningful results. They save time and reduce errors in calculations. Using software or calculators makes the process easier and more accurate.
Popular Statistical Software
Many researchers use software like SPSS and R for testing significance. SPSS offers a user-friendly interface and handles complex data easily. R is free and flexible, ideal for custom analysis. Another option is SAS, known for powerful data management. These programs provide detailed reports and visualizations. They support various tests, from t-tests to ANOVA. Learning basic commands or menus helps run tests fast.
Online Calculators
Online calculators offer quick solutions without software installation. They handle common tests like chi-square and z-tests. Users enter data or summary statistics to get results instantly. These tools are great for simple experiments or quick checks. Most calculators show p-values and confidence intervals clearly. They work on any device with internet access. Free online tools are easy to find and use. They help beginners understand significance testing better.
Practical Examples
Understanding statistical significance becomes clearer with real-world examples. These examples show how to apply the concept in everyday research. They help explain complex ideas in simple ways. Practical examples make statistics less abstract and more useful.
Measuring Significance In Surveys
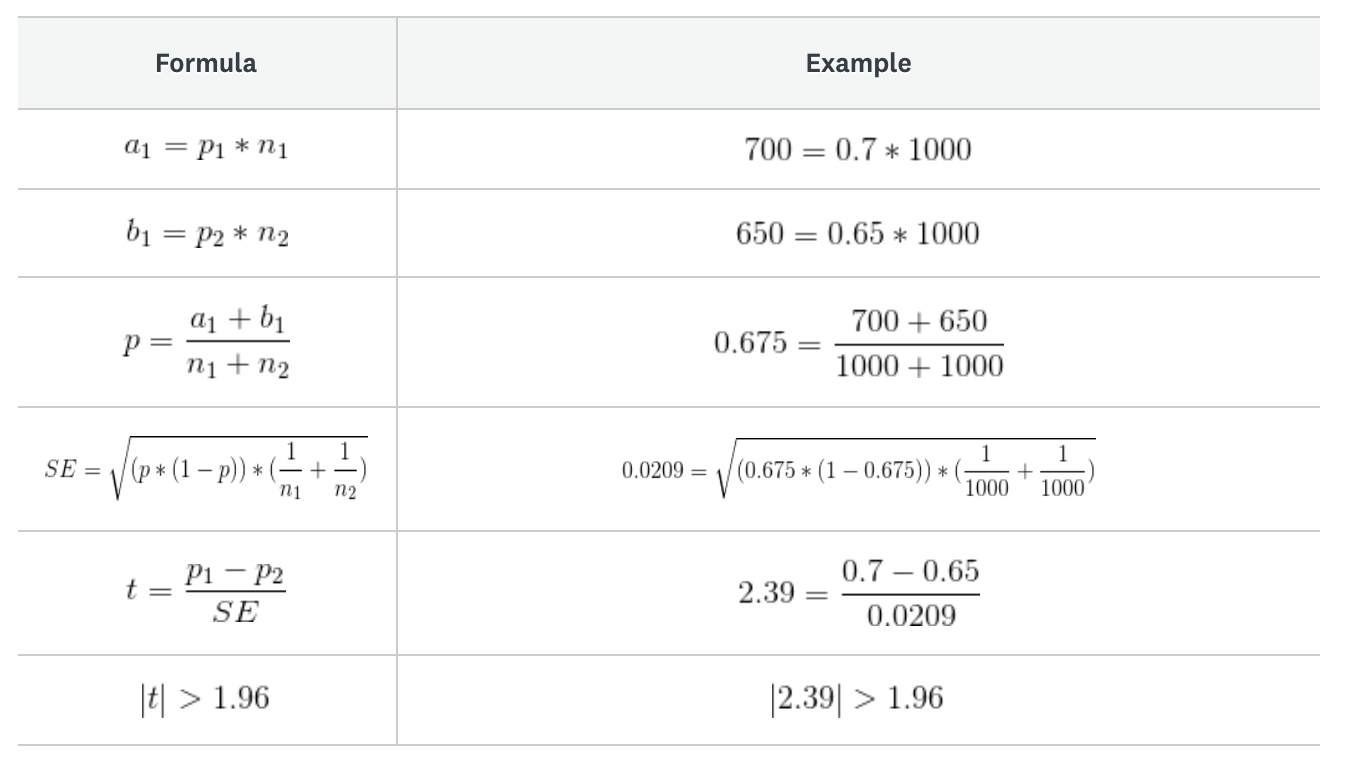
Imagine a survey testing if people prefer brand A over brand B. Researchers collect responses from 500 participants. They find 280 prefer brand A, and 220 prefer brand B.
To check if this difference is meaningful, they use a statistical test. The test calculates a p-value. This value shows the chance the result is random.
If the p-value is less than 0.05, the result is significant. It means the preference for brand A is likely real. If higher, the difference may be due to chance.
Application In Clinical Trials
Clinical trials test new medicines to see if they work better than old ones. Suppose 100 patients get a new drug, and 100 get a placebo. After treatment, 70 patients improve with the drug. Only 50 improve with the placebo.
Researchers use statistical tests to compare these results. A low p-value shows the new drug is effective. It suggests the improvement is not by chance.
This method helps doctors trust new treatments. It ensures medicines are both safe and useful before approval.

Credit: standard-insights.com
Frequently Asked Questions
What Is Statistical Significance In Simple Terms?
Statistical significance shows if results are likely due to chance or a real effect. It helps confirm findings are reliable and not random.
How Do You Calculate Statistical Significance?
You calculate it using a p-value from tests like t-test or chi-square. A p-value below 0. 05 usually means significance.
Why Is P-value Important In Statistical Tests?
The p-value measures the probability that results happened by chance. Lower p-values indicate stronger evidence against the null hypothesis.
What Role Does Sample Size Play In Significance?
Larger sample sizes improve the accuracy of results and help detect true effects, increasing the chance of finding statistical significance.
Conclusion
Measuring statistical significance helps you understand if results matter. It shows if differences happen by chance or not. Knowing this guides better decisions in research and daily life. Always check the p-value and sample size carefully. Use clear steps to avoid mistakes in your analysis.
Practice these methods to build confidence in your findings. Statistical significance is a useful tool for clear, reliable results. Keep learning and applying it to improve your work.